Reports 22.2
Net Savings Column Added to Bundle History Report
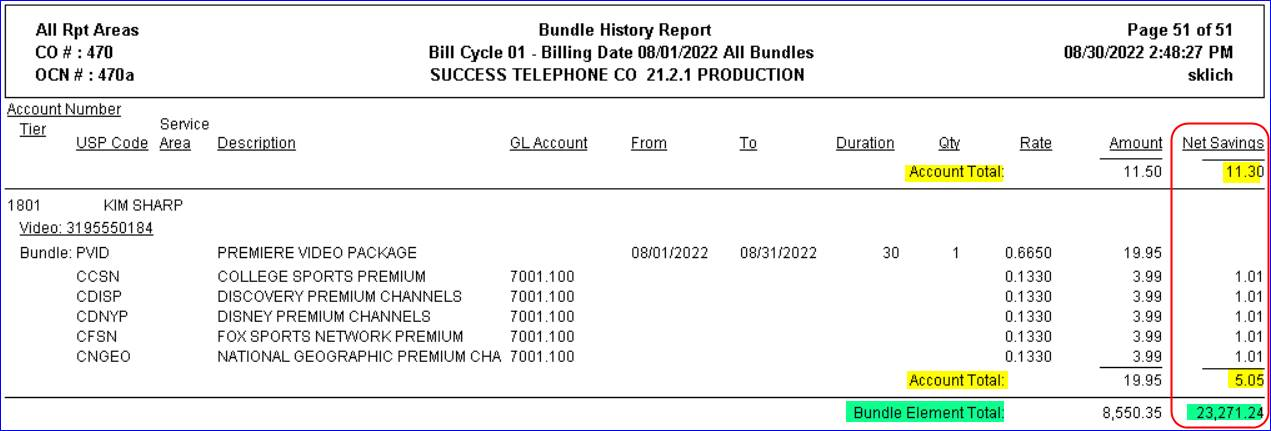
The Bundle History Report was updated to include a Net Savings column with a savings total for each USP Code element within a Bundle. The report will also include a Net Savings total for each account, as well as a grand total of the Net Savings on the last page of the report. This new column will provide clarity if auditors request to see the “net savings” for each USP Code discounted within a Bundle. With this addition, users can not only view the actual billed amount but what the net savings are for each line item discounted within the Bundle.
Report Suite | Processing | Reports | Billing | Bundle History: A Net Savings column was added to the Bundle History Report. The column displays the savings amount for each USP Code element within a Bundle. In the example, Account 1801 has the PREMIERE VIDEO PACKAGE Bundle which has five elements with a Net Savings of $1.01 each. A total of the Net Savings amount for the account is included in the Account Total line equaling $5.05. The Net Savings total is displayed on the last page of the report in the Bundle Element Total line in the amount of $23,271.24. The billed amount of each Bundle element continues to display in the Amount column.
Denied Services Tracking and Reporting
Tracking services denied due to infrastructure needs in providing services to customers can be challenging for companies. A new Grid Report, Address-Denied Service, was added to track and report on instances of denied services. In addition to the report, mapping features in Customer Master were enhanced for users to view areas where services have been denied on a map. These enhancements will empower clients to meet their annual reporting requirements and provide useful business intelligence for future infrastructure deployments.
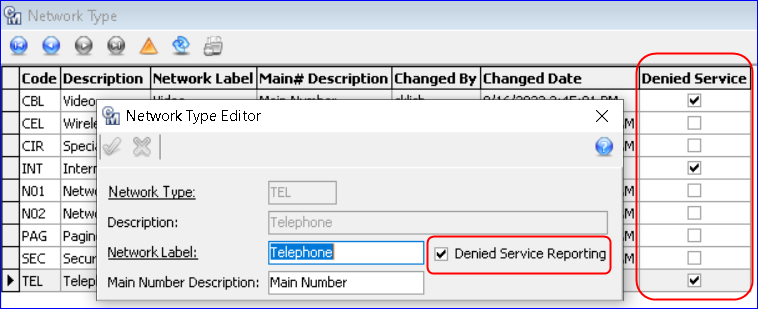
File | Preferences | Network Type Preferences | Network Type: A checkbox labeled “Denied Service Reporting” was added to the Network Type Editor. When checked, the Network Type will be available for Denied Service reporting as well as in a viewable Network Type for Denied Services in Map-It. A Denied Service column in the Network Type grid allows users to easily see which networks are flagged.
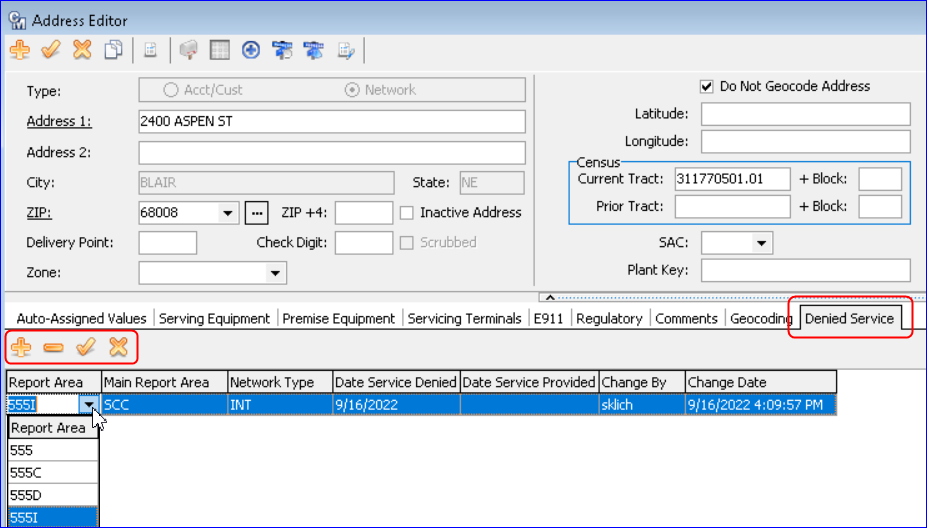
Maintenance | Common | Address | Address Editor: A tab for Denied Service was added to the network address type. When selected the Denied Service tab will display a grid with the following columns:
- Report Area
- Main Report Area
- Network Type
- Date Service Denied
- Date Service Provided – Will be blank. A calendar dropdown allows users to populate the date when the service was provided at the address. Adding a date indicates services were previously denied but are now available at the address.
• Change By
• Change Date
Grid dropdowns are available to edit the fields. Only one active row may exist for a given Network Type for a given address. Buttons on the toolbar allow users to manually Insert, Delete, Post, and Cancel.
Service Order | Network Tier: A Denied Service icon was added on the Service Order Network screen. The button is available from any network tier.
Clicking on the icon takes the user to the Network Service Address in the Address Table opened to the Denied Service tab described previously. Users must select the Insert button to populate the network information from the Service Order. Review the information, and if correct, Post your changes. Doing so flags the address as having denied service. Should service become available at the address, users can return to the Denied Service tab and use the “Date Service Provided” dropdown and select the date the service was provided.
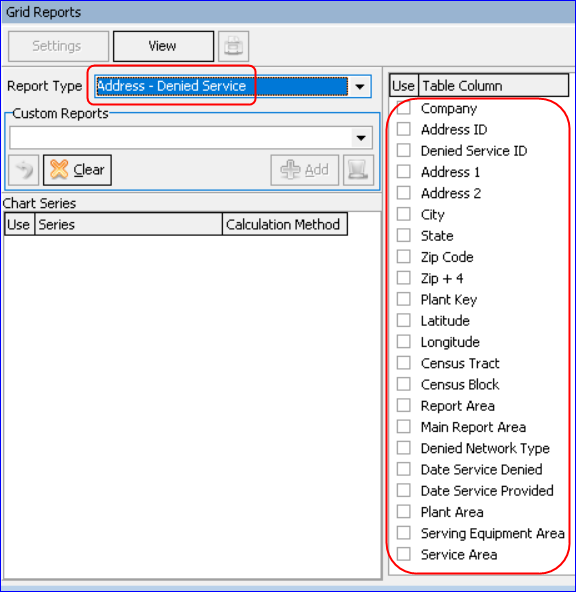
Reports Suite | Grid Reports | Report Type | Address – Denied Service: To identify what addresses have requested service, but were denied, a new Address Grid Report was added for Denied Services reporting.
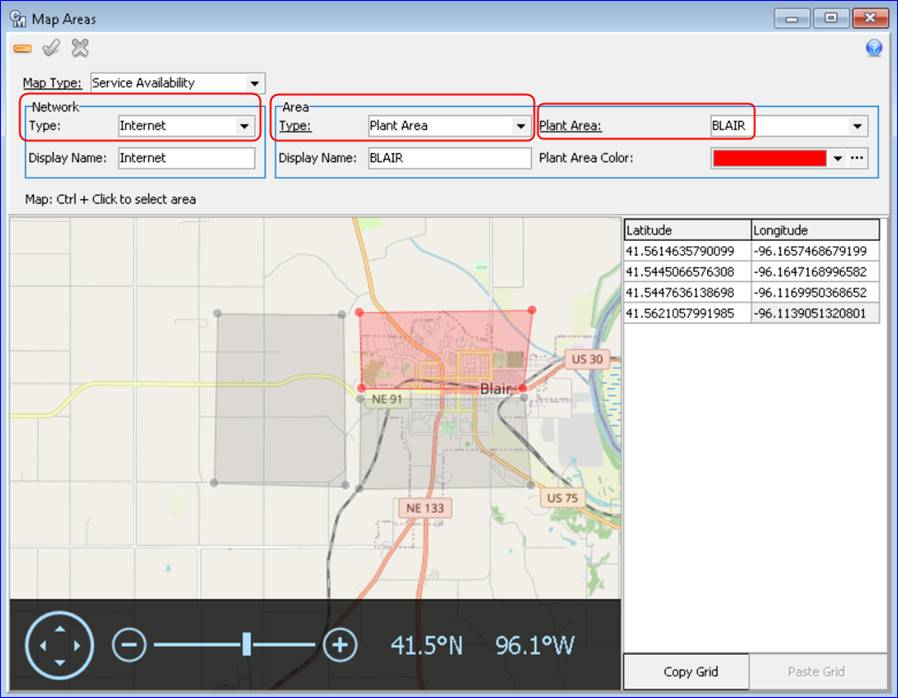
Maintenance | Mapping | Map Areas: In addition to the new grid report, if users would also like to see a map view of denied services, the Map Areas and Map-It feature in Customer Master can be utilized. Users will need to have a Service Availability map drawn at Maintenance | Mapping | Map Areas as well as tracking denied services established to utilize the map view of denied services. To map Denied Services, map areas created using the existing Service Availability Map Type Interface must be assigned both a Network Type and Area Type to correctly display denied services details for each area.
In the example, three areas were drawn for denied services for Telephone, Internet, and Cable, each with an Area Type of Plant Area.
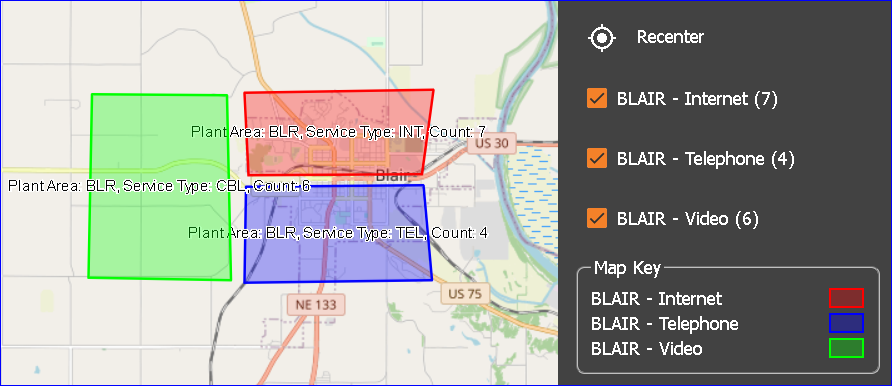
Web | Web Map-It | Service Availability tab: The Denied Services areas will be displayed on the map in conjunction with the Service Availability map and settings. A group box for “In-Demand (Denied Services)” has been added to the Service Availability tab in Map-It. To use this feature, first select the Area Type that was drawn in Maintenance | Map Areas for Denied Services, which in our example was Plant Area. Select a Network Type to view individually by the network on the map or select “All Network Types.” Place a check in the “In-Demand (Denied Services)” check box to view Denied Service Details for areas on the map. Use the calendar dropdown and select a Begin Date and End Date for the Denied Service areas to view on the map. The Begin and End Dates are not required. If no date is provided, the map will only display active denied service records in each area.

